Charted Data: The Ultimate Single-Page Guide
Welcome to the comprehensive, all-in-one manual for Charted Data. This guide is designed to get you from zero to a live, professional data-driven blog in under 10 minutes.
🛠️ 1. Quick Start: Your 3-Step Launch
Follow these steps to get your site live. Even if you've never used Next.js before, this "no-brainer" method will work for you.
Step 1: Fork and Download
- Visit the Charted Data Repository.
- Click the "Fork" button at the top-right. This gives you your own copy of the code.
- Download it to your computer:
git clone https://github.com/your-username/charted-data.git
cd charted-data
bun install  # or 'npm install'
Step 2: Customize Everything (config/site.ts)
The easiest way to change your site's name, logo, and links is through the configuration file. No coding required—just change the text.
- Open
config/site.tsin your code editor. - Update the details to match your brand:
export const siteConfig = {
  name: "My Awesome Data Blog",
  description: "Interactive insights and data stories.",
  url: "https://your-domain.com",
  links: {
    twitter: "https://twitter.com/yourhandle",
    github: "https://github.com/yourusername",
  },
  ...
};
This single file updates your headers, footers, SEO tags, and social links instantly!
Step 3: Launch on Vercel (The "No-Brainer" Way)
- Go to Vercel.com and sign in.
- Click "Add New" → "Project" and choose your
charted-datarepository. - Important: Before clicking deploy, add these Environment Variables in the Vercel dashboard:
- ADMIN_EMAIL: Your personal email address (used for logging into the admin panel).
- DATABASE_URL: Your connection string (from your Neon.tech project settings).
- NEON_AUTH_BASE_URL: Your authentication link (from your Neon Auth Dashboard).
- NEON_AUTH_COOKIE_SECRET: A 32-character secret (Type
openssl rand -hex 32in your terminal to get one).
- Click "Deploy". Your site is now live!
🔐 2. Admin Panel: Your Command Center
Access your built-in CMS at /admin to manage your data-driven stories.
Logging In
Charted Data uses a secure, passwordless OTP (One-Time Password) system for administrators.
- Navigate to
/admin. - Enter the email address you set in your
ADMIN_EMAILenvironment variable. - Check your inbox for a 6-digit code.
- Enter the code on the site, and you're in!
Using the Dashboard
Once logged in, you can:
- Write Stories: Create and edit posts using the real-time Markdown editor.
- Manage Drafts: Save your work-in-progress without publishing it immediately.
- Feature Content: Toggle the "Home Page Highlight" for your best articles.
- Smart Slugs: Let the system automatically generate SEO-friendly URLs for you.
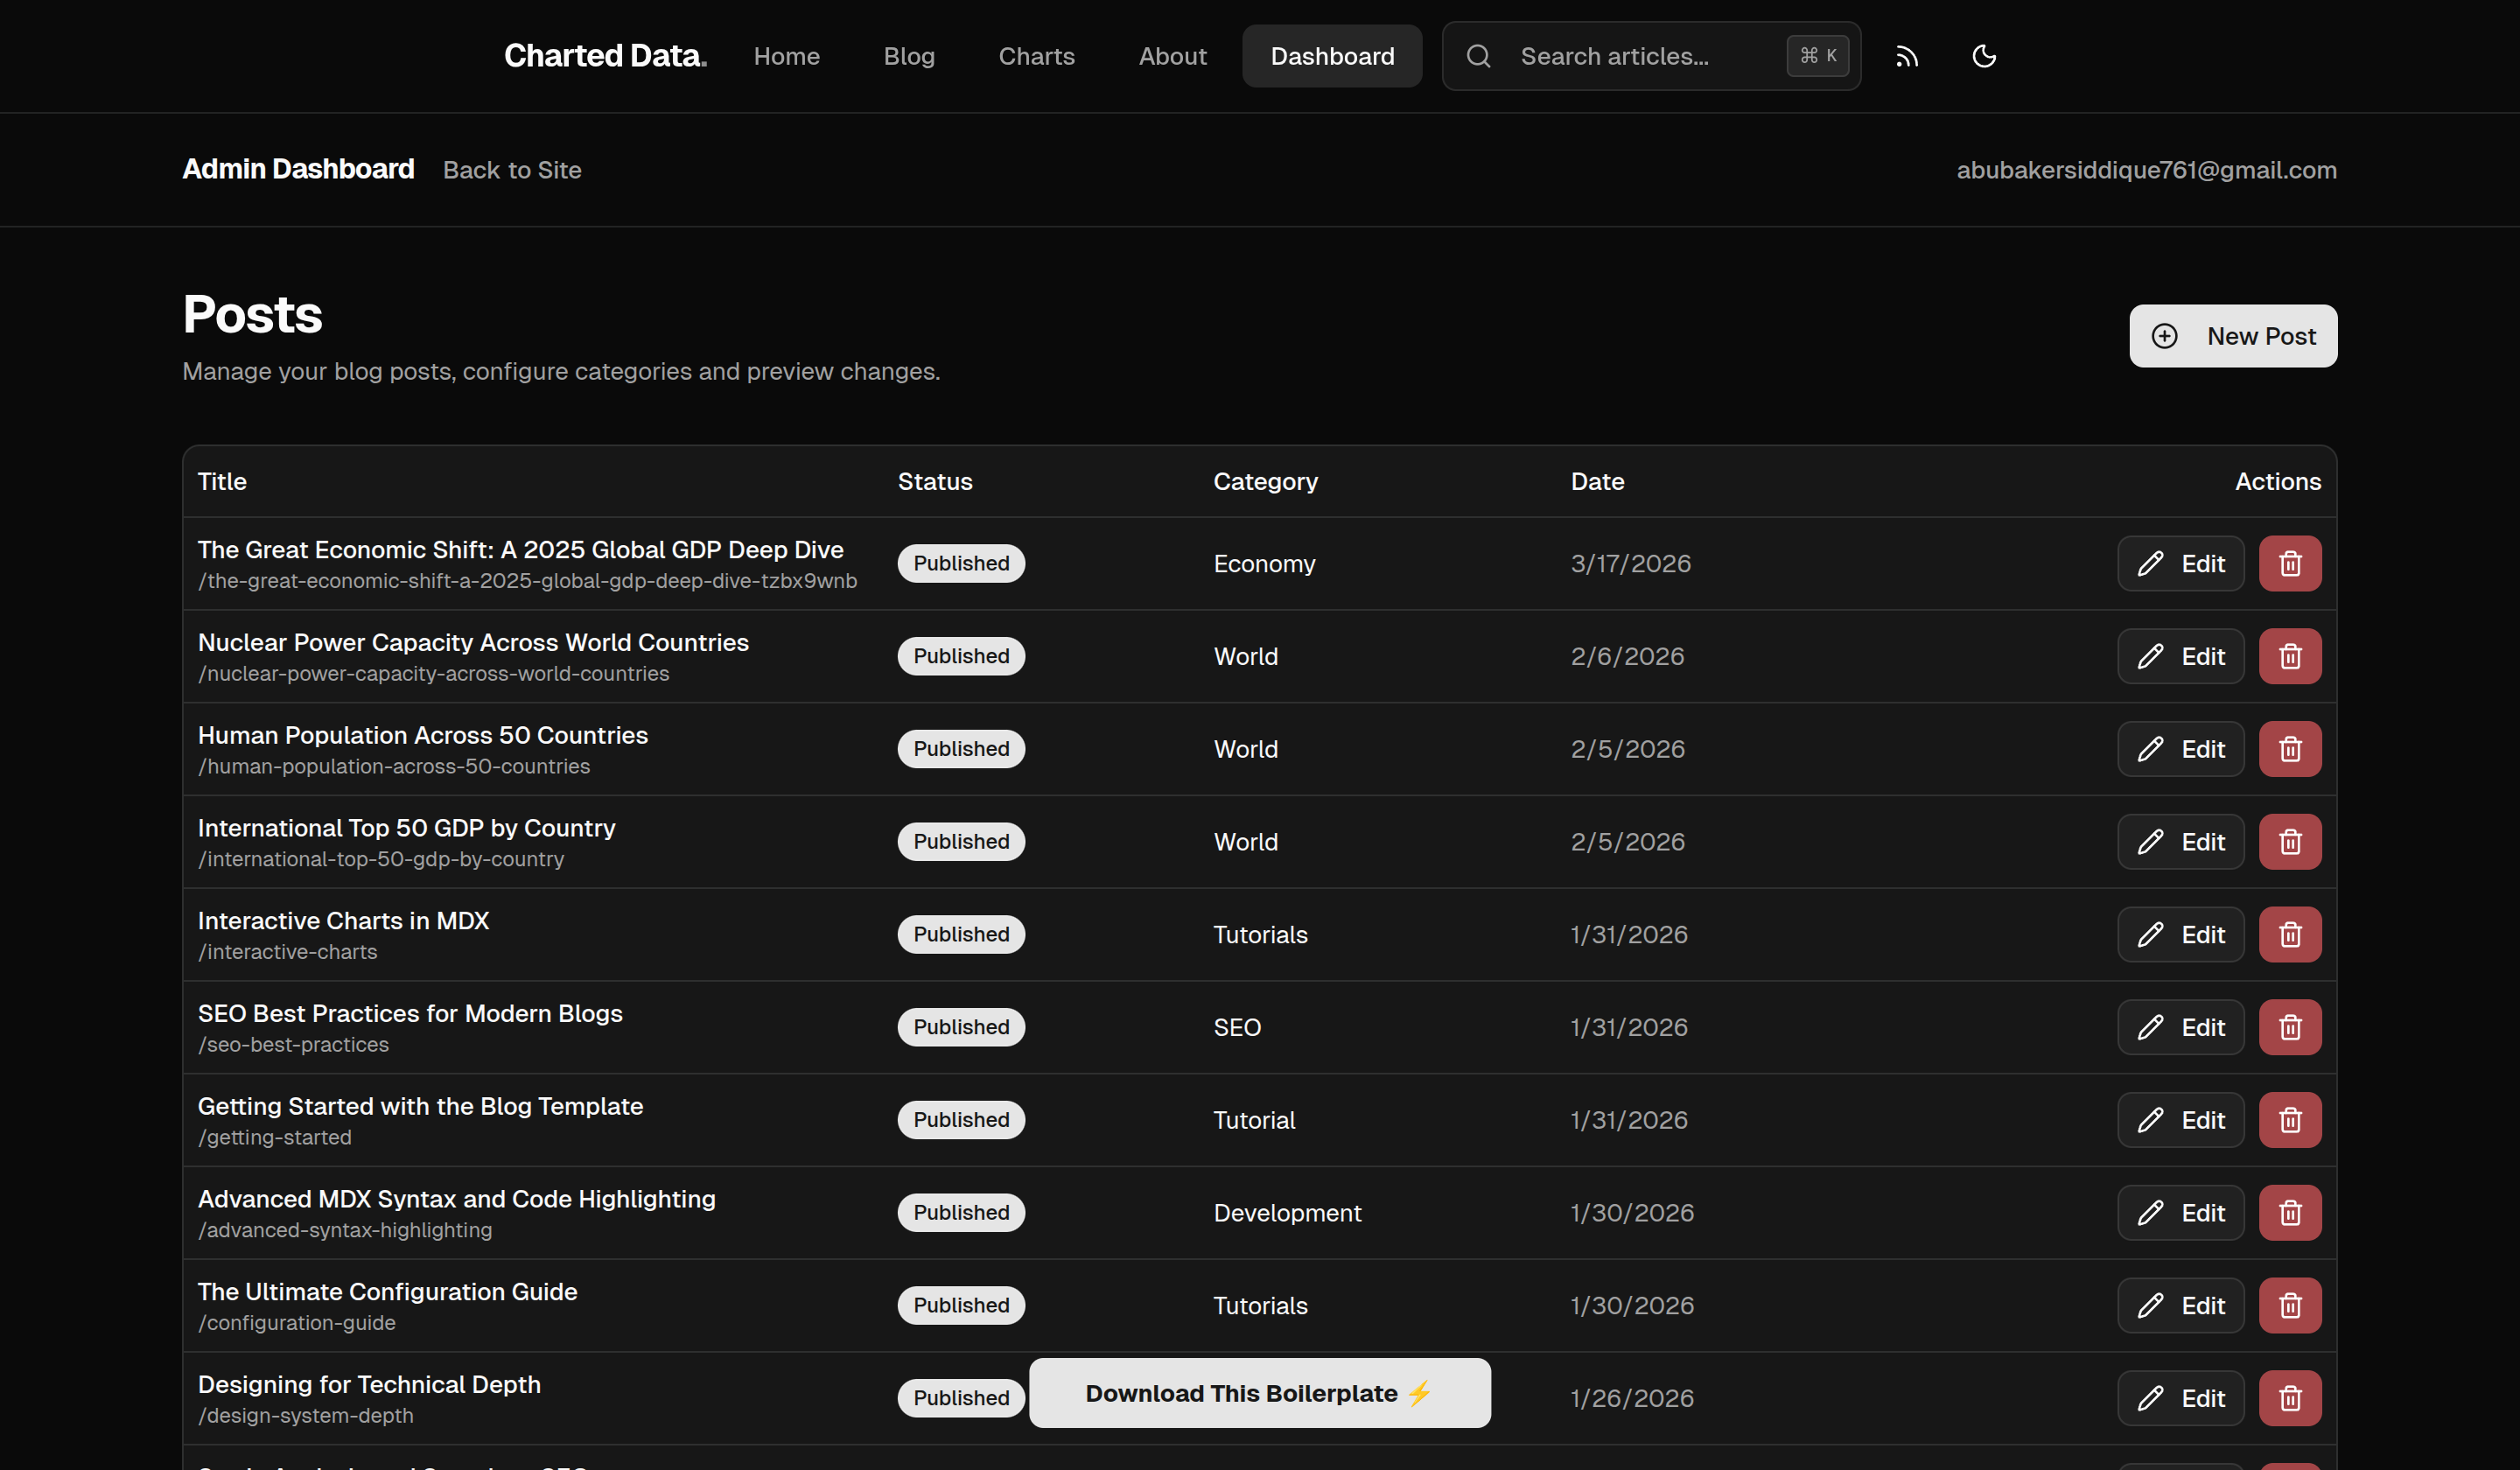
1. The Overview Dashboard
When you log in, you are greeted with the main dashboard. Here, you can view a list of all your published and draft posts. You can quickly see the status of each post, edit existing ones, or navigate to create a new story.
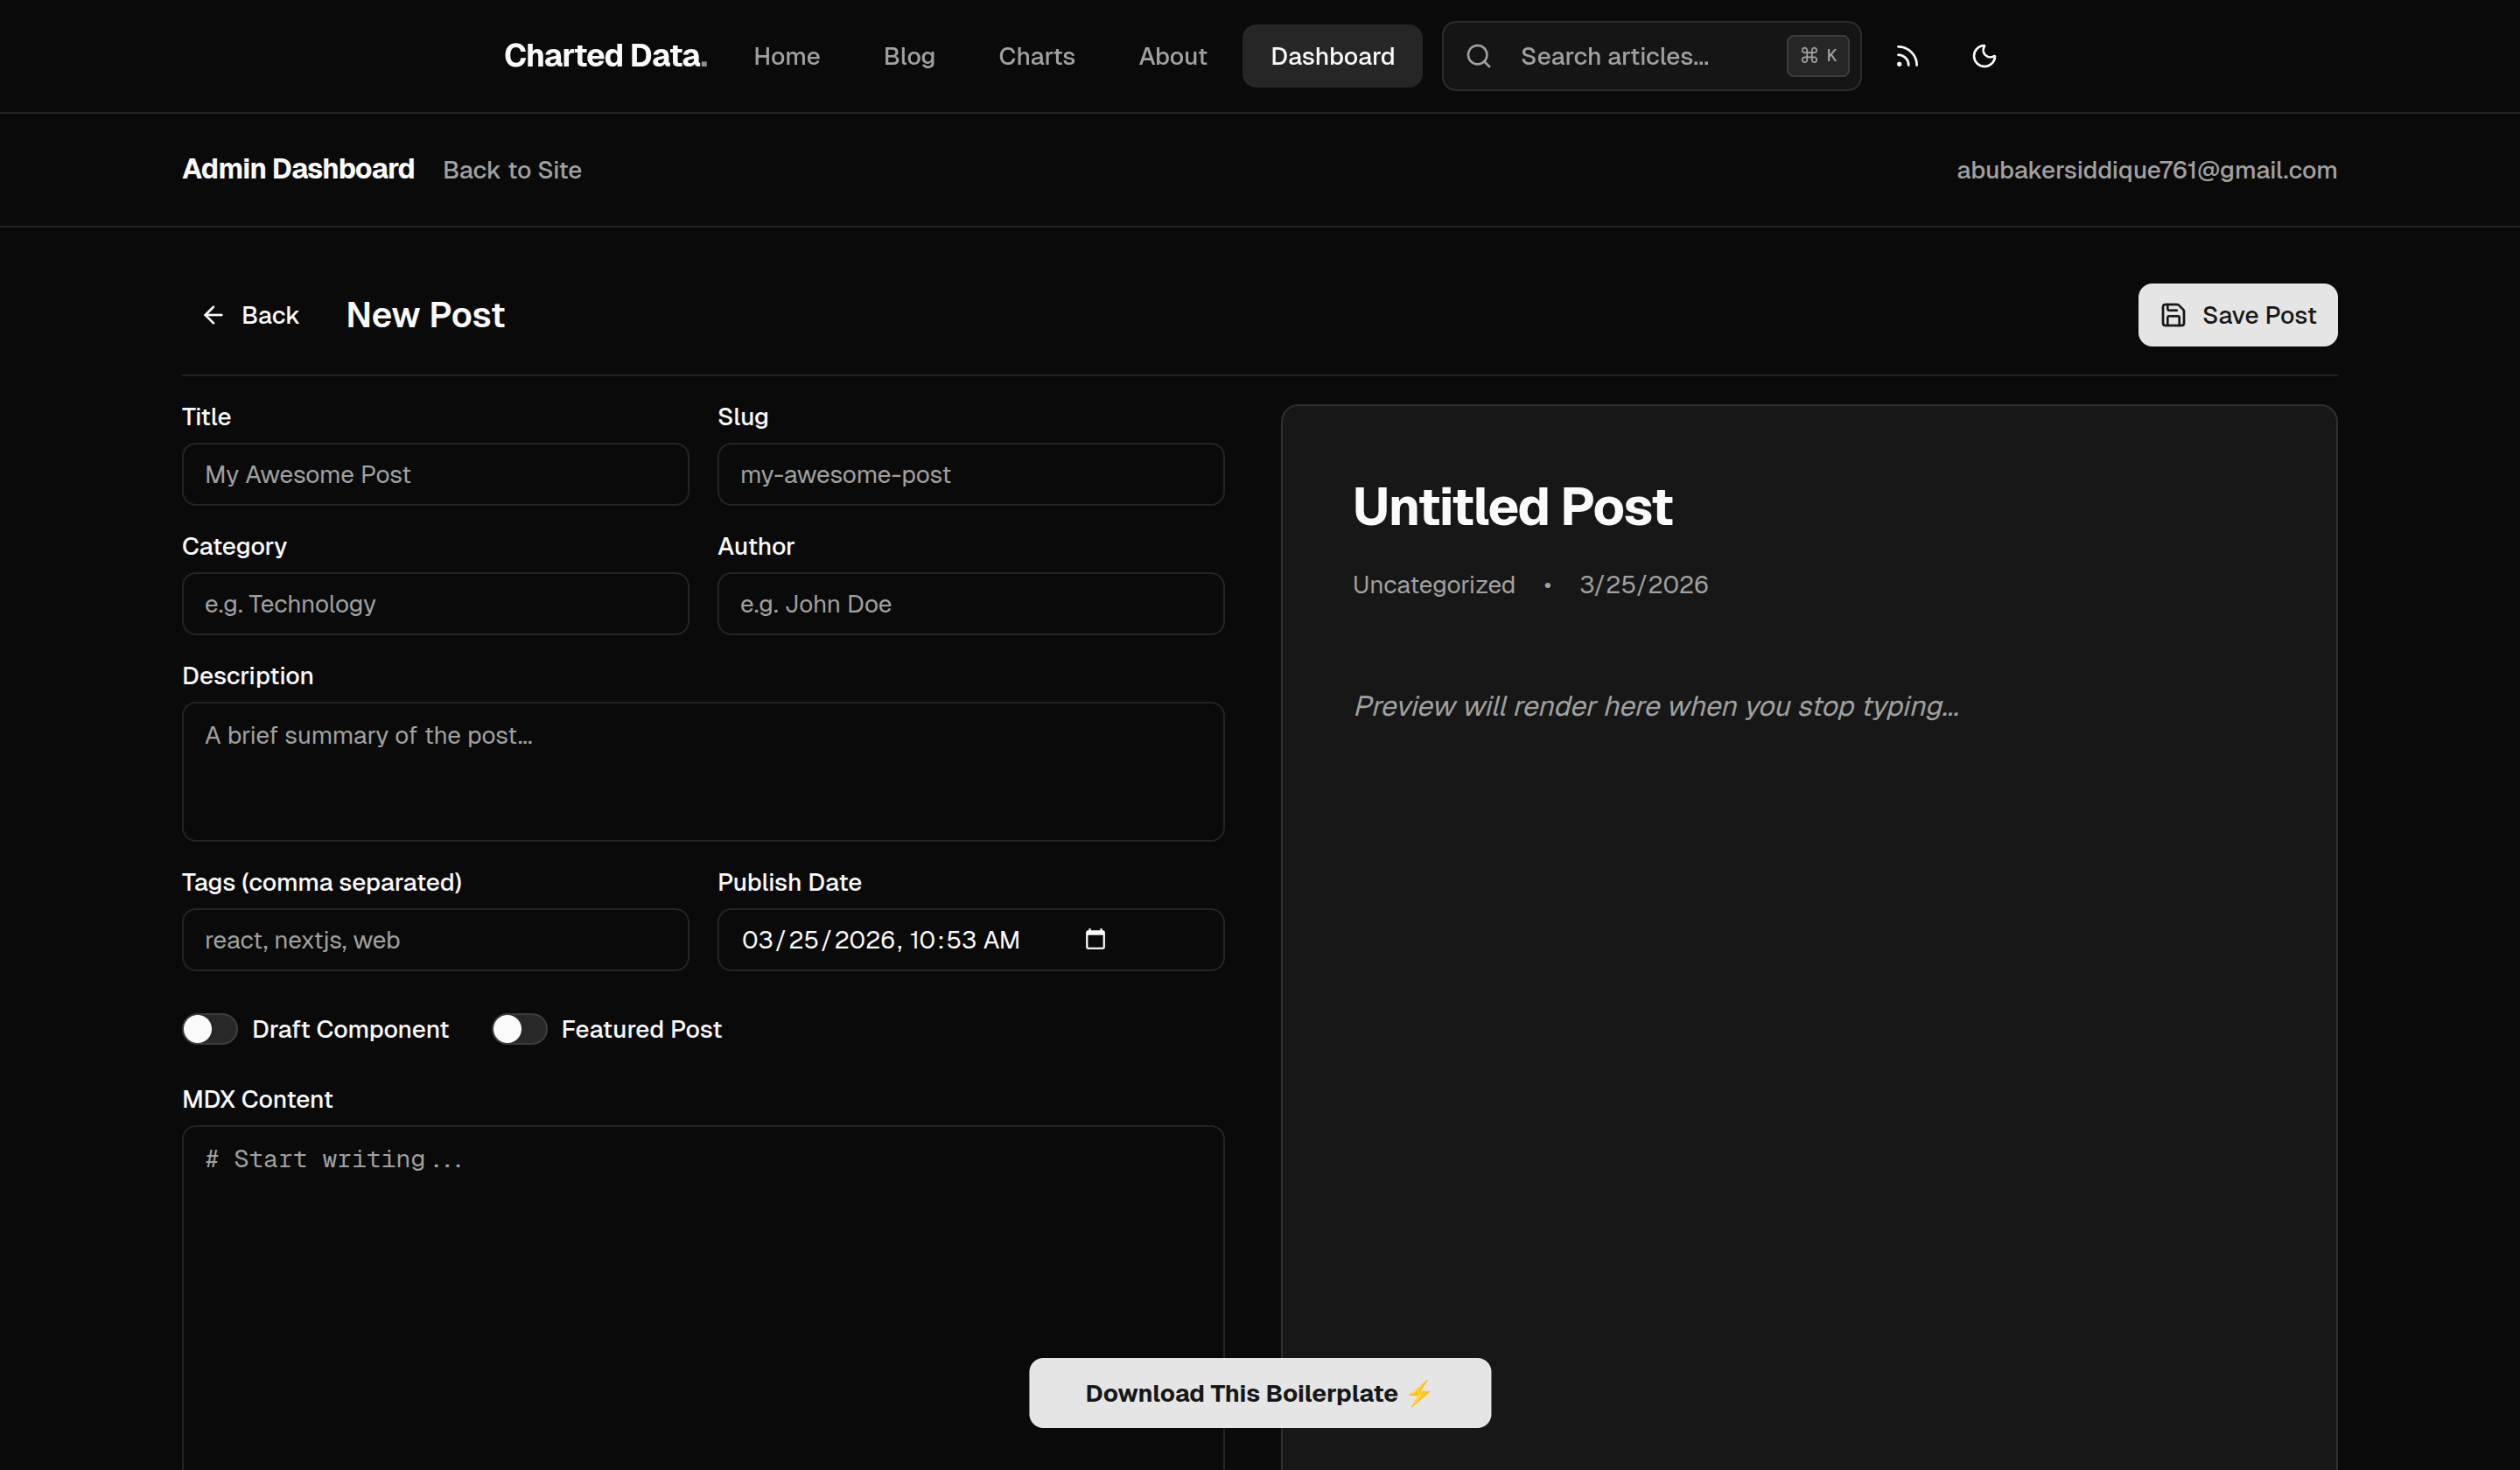
2. Creating a New Post
Clicking to create a new post opens the powerful markdown editor. You have a clean workspace where you can input your post title, customize the URL slug, and write your content. You can also toggle whether a post is published or featured on the homepage.
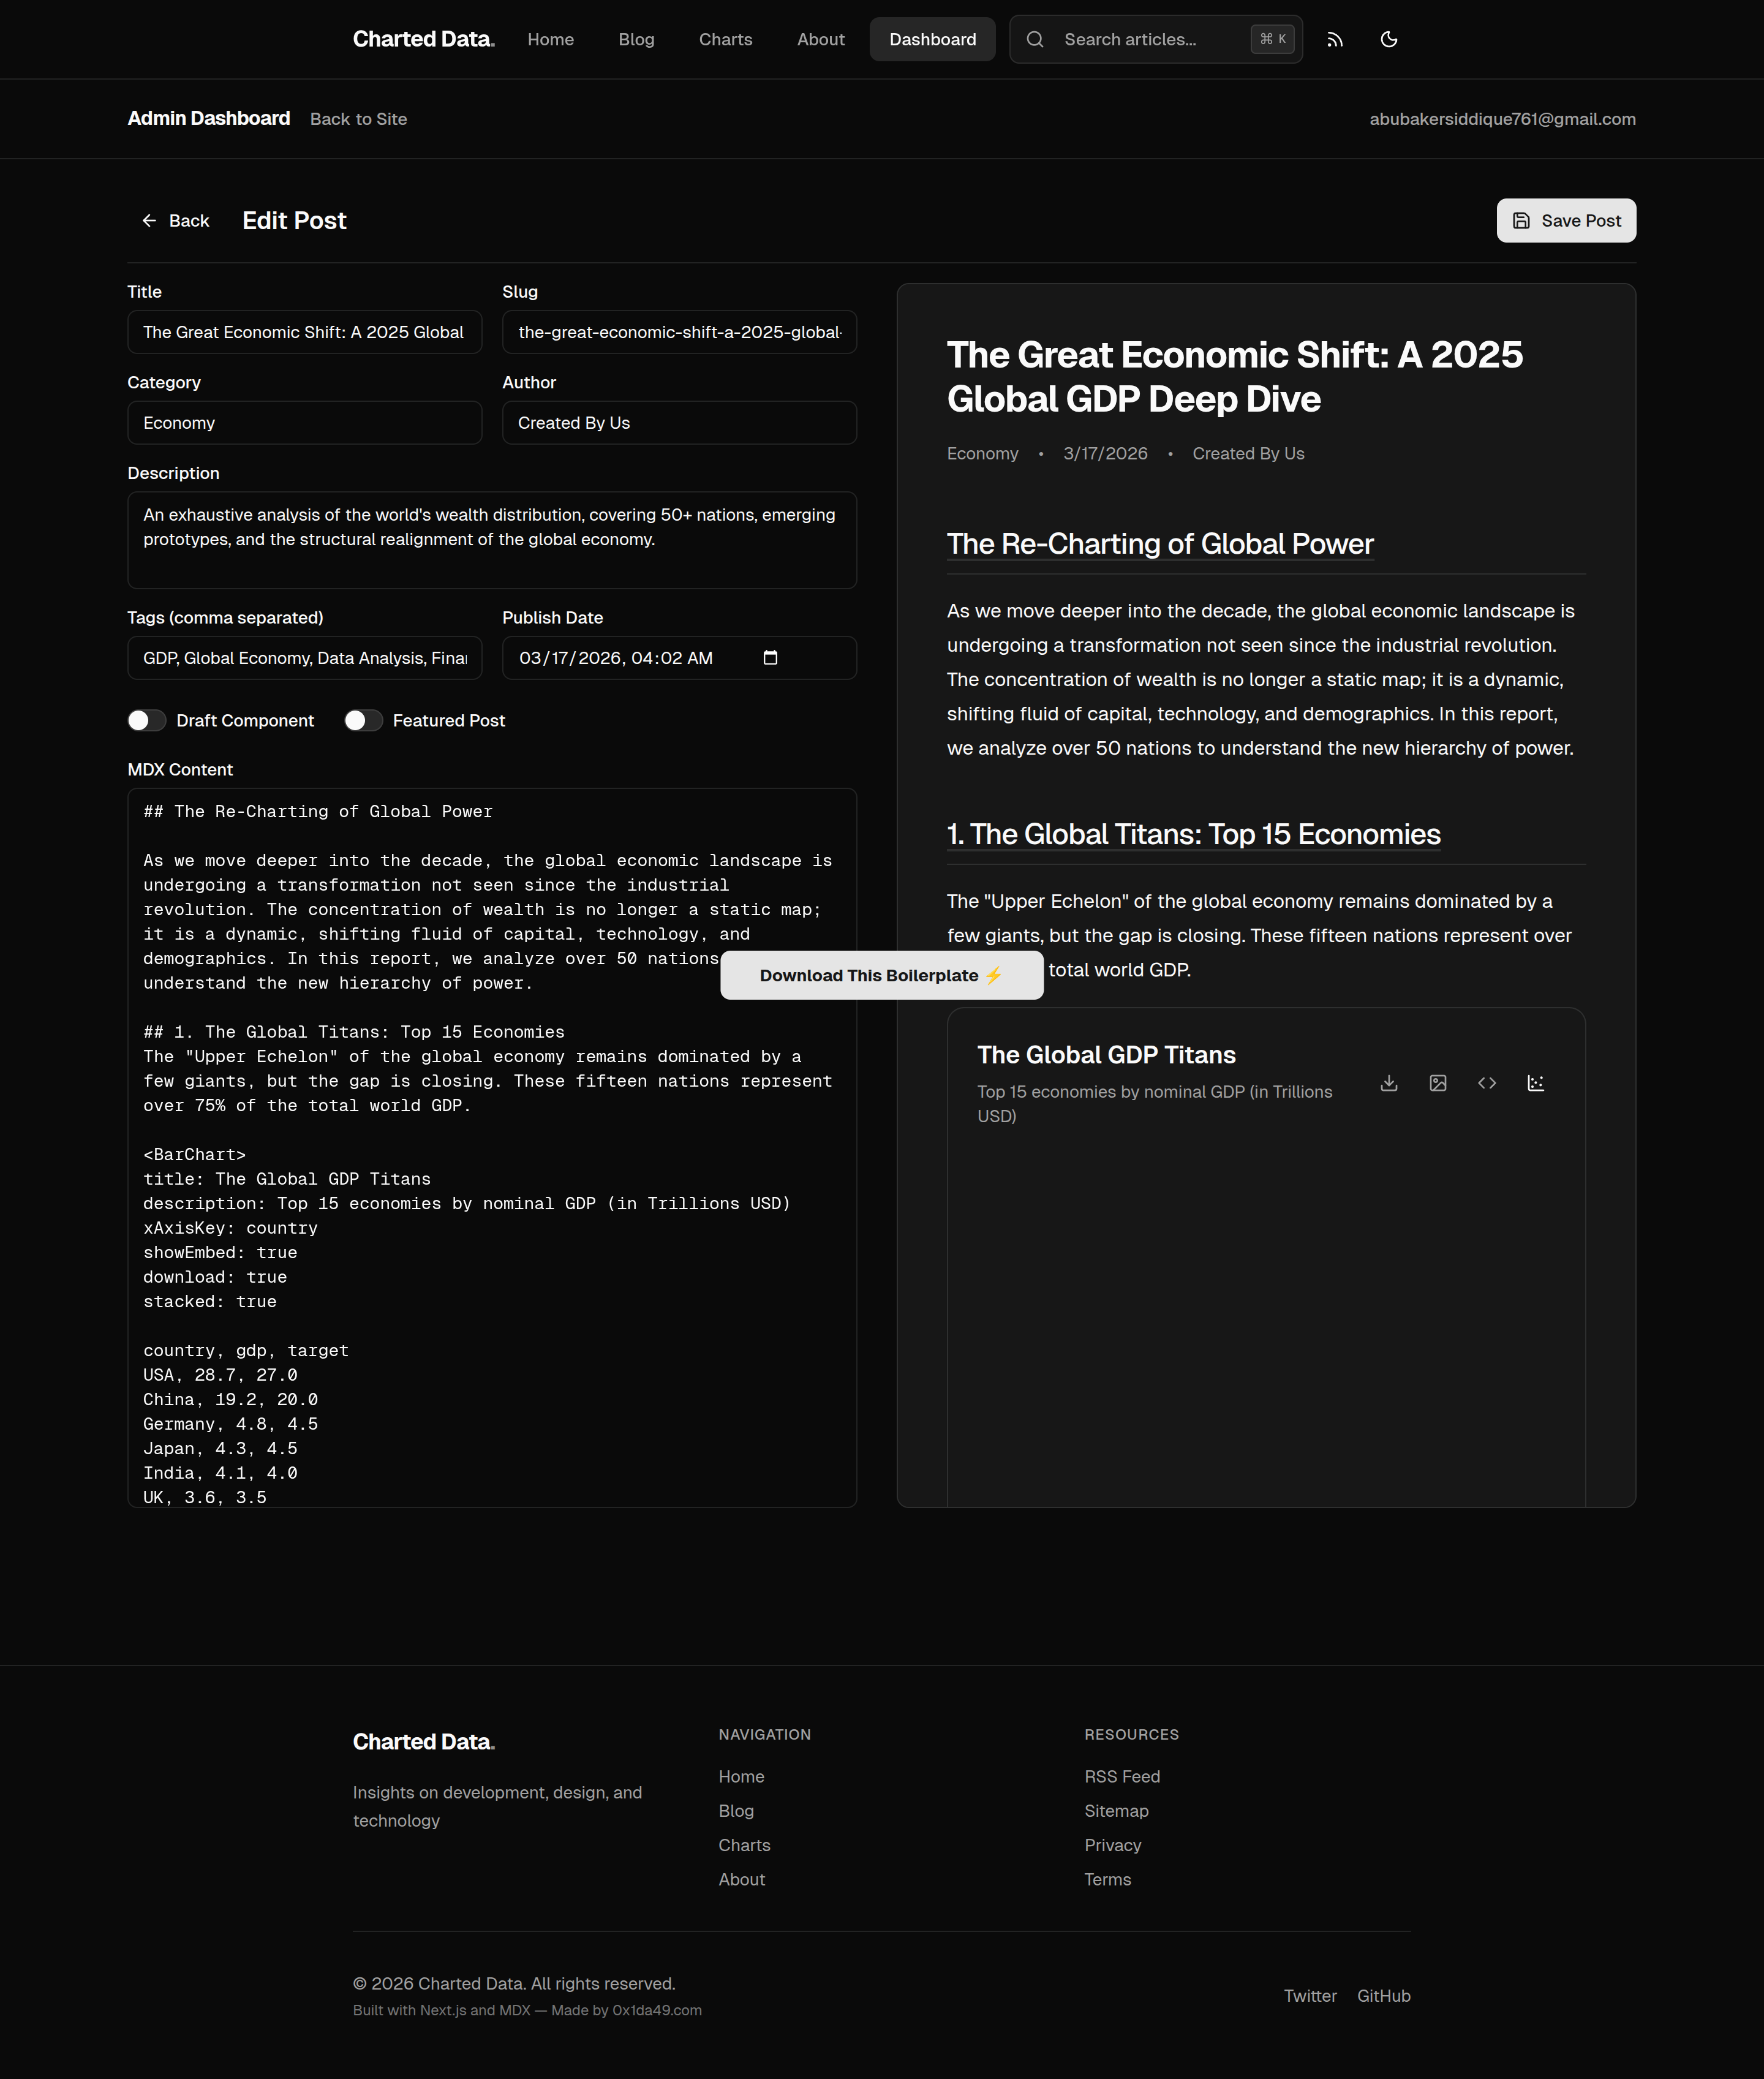
3. Editing Existing Posts
When you edit an existing post, you get the same editor pre-filled with your content. You can update your markdown, change the publication status, and save your changes seamlessly.
📊 3. Visual Guides & Deep Dives
Explore our interactive guides to see Charted Data in action. These live previews demonstrate the full power of the engine, from data visualization to advanced formatting.
📈 Interactive Charts
Master the art of data storytelling. Learn how to transform raw CSV data into beautiful, interactive Bar, Line, and Area charts with zero effort.
💻 Advanced Syntax Highlighting
A billionaire-grade blog needs billionaire-grade code snippets. See how our engine handles multiple languages, line highlighting, and copy-to-clipboard functionality.
⚙️ Configuration Guide
Learn every detail of the config/site.ts file. This guide covers how to customize your branding, SEO, social links, and feature toggles from one central place.
🚀 Getting Started Deep Dive
A comprehensive walkthrough for newcomers. If you need more detail than the Quick Start above, this interactive tutorial covers every edge case of the installation.
You are now ready to build the future of data-driven storytelling. Happy writing! ⚡