
Stop Hiding Your Metrics Behind Screenshots.
Embed interactive charts in your blog—no embeds, no iframes, no external tools. Just write markdown and add a chart. That's it.
Why charts don't work on your blog RIGHT NOW
- Screenshots get outdated: You take a picture of your analytics. Two days later, it's completely irrelevant.
- Embedded charts slow down your page: Iframes load heavy external JavaScript that ruins your Lighthouse score.
- Readers don't engage with static images: They just scroll right past them.
- You can't share live data: It feels dead and disconnected from your actual product.
Charted Data fixes all of this
- Write markdown, embed charts in seconds: No complex setups.
- Charts stay on YOUR domain: You get 100% of the SEO benefits, not some 3rd party SaaS.
- Readers can filter and download data: Every chart has built-in export functionality.
- Beautiful on all devices: Fully responsive on mobile, desktop, and fully supports dark mode.
How it works
Step 1: Write
Just type this directly into your blog post markdown file:
<LineChart data={revenue} />Step 2: Result
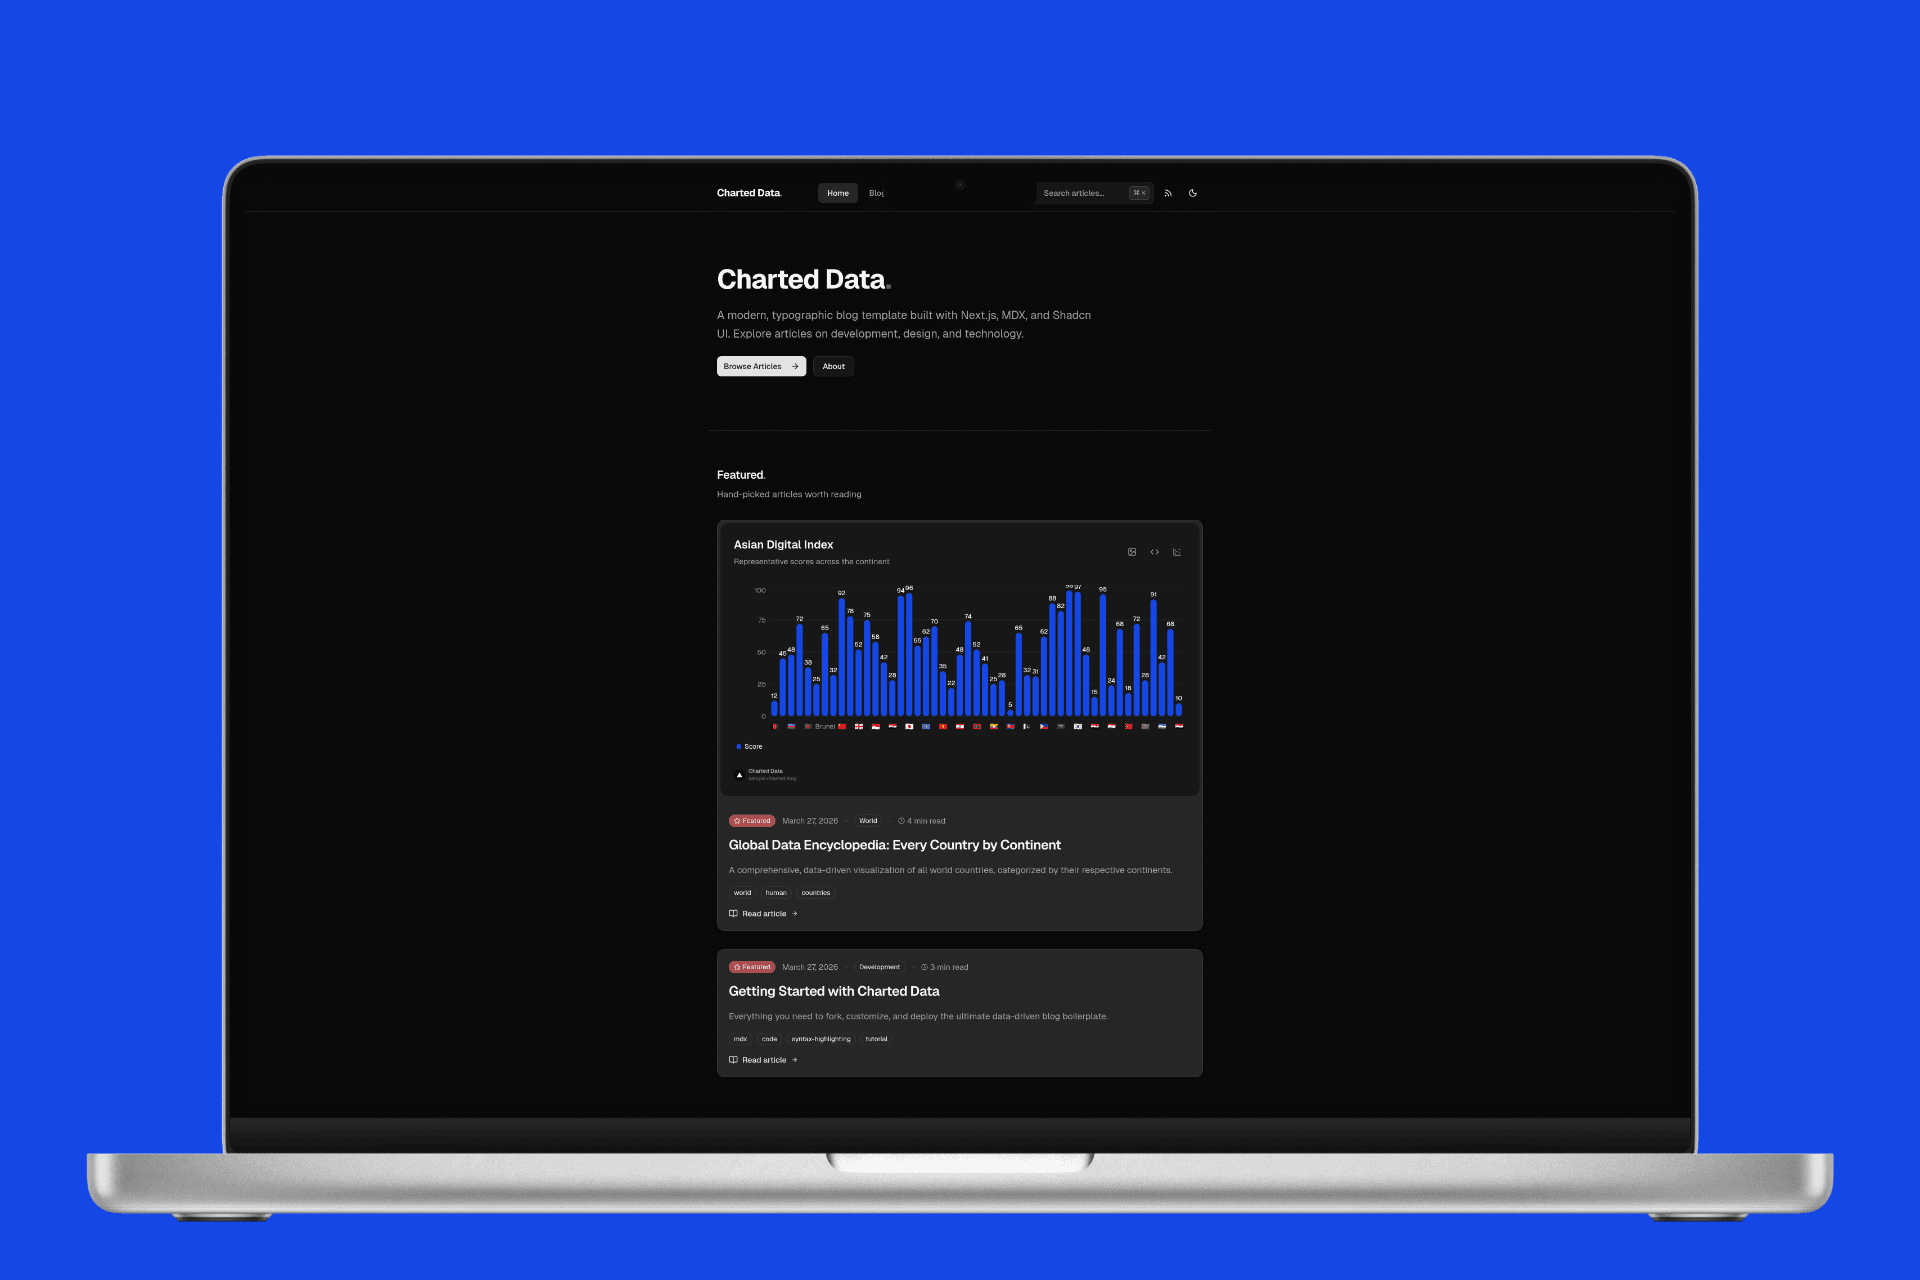
A beautiful interactive chart appears instantly on your live site.
Step 3: Interact
Your reader clicks the chart. They can filter the metrics, view tooltips, export it as a PNG, or download the raw CSV data.
7 Charts You Get
- Bar Charts (compare data)
- Line Charts (trends over time)
- Area Charts (growth visualization)
- Pie Charts (percentages)
- Radar Charts (multi-dimensional)
- Radial Charts (gauges)
- Composed Charts (mixed types)
Trusted by indie hackers and founders
"Finally, a way to share metrics that actually looks good."
— John Doe, Indie Hacker
"My blog metrics went from boring to beautiful."
— Jane Smith, Newsletter Creator
"This is the tool I've been waiting for."
— Bob Johnson, Startup Founder
Simple, lifetime pricing. $129 ONE-TIME.
Not a subscription. You keep it forever. Skip the monthly fees and get the exact infrastructure I use to build profitable data websites.
- Full source code (yours forever)
- Lifetime updates
- Email support
- 30-day money-back guarantee
Frequently Asked Questions
Do I own the code?
Yes, 100%. You download it, deploy it to your own Vercel account, and host it anywhere.
Can I customize it?
Yes, it's open source (for you). You have full control over the Next.js and Tailwind codebase.
What if I need help?
Email support is included. I respond within 24 hours.
Do I need to be a developer?
A basic understanding of markdown and React helps, but there is comprehensive documentation to guide you.
Is there a monthly fee?
No. It is a $129 one-time payment, then it's yours forever.
Ready to make your metrics beautiful?
Join the founders and developers who are launching beautiful data websites in hours instead of weeks.